Optical fiber communication has the advantages of high efficiency, light quality, large information transmission and low consumption. It is used in various communication technology fields such as telephone, computer communication, cloud data accessibility, Internet use, etc. Therefore, ensuring the safety of optical cables directly affects the real-time, reliability and accuracy of the communication system .
However, due to the shortcomings of the brittle texture of the optical fiber, the complex structure of the connection point and the low mechanical strength, the optical fiber is very prone to failure in the laying and working process. In addition, the traditional optical cable diagnosis system has problems such as long maintenance cycle and difficulty in fault location, which seriously affects the safe operation of the communication network. At present, the optical time domain reflector (OTDR) is mainly used to monitor and locate optical cable faults. The direction of optical cables is complex. This technology can monitor the distance information from the fault point, but it cannot display geospatial location, which seriously affects the fault location and maintenance of communication optical cables .
For the fault location technology of optical cable, scholars at home and abroad have done a lot of research, such as combining the simple and easy pulse ranging method and the high sensitivity characteristics of the photon counting method, the photon counting OTDR technology ; it is limited to waveguide structural devices, and cannot be widely popularized in the process of practical application. Based on the visual search algorithm, the high-precision positioning of communication optical cable failure is realized through a semiconductor laser ; but its technical requirements and cost are high. Based on digital coherent detection and Wiener filtering technology, phase-sensitive OTDR is proposed, which can realize the synchronous monitoring of fault location, disturbance signal intensity and frequency of long-distance communication optical cables ; however, the system requires high coherent detection light and the measurement error is large. Judging from the existing research at home and abroad, most of them ignore the reality of fault diagnosis, and it is difficult to achieve reliable and accurate fault location by relying only on the distance measurement between the fault point and the detection point.
The optical fiber communication industry has completely changed the telecommunications industry by providing more reliable telecommunications links, higher performance and decreasing bandwidth costs. The progress of optical fiber communication technology has promoted the development of optical fiber sensors. Based on this, the optical fiber Bragg grating (FBG) is introduced on the basis of Φ-OTDR technology to locate the optical cable fault. At the same time, combined with geographic information system technology (GIS), the intelligent monitoring of the upper communication optical cable in the electronic map is realized, and the N# distribution room of Jianshe East Road in a city to the distribution room of Zhongyuan East Road is carried out.
The actual fault of underground communication optical cable is an example, which verifies the effectiveness of the intelligent monitoring method, in order to provide a useful reference for the maintenance and management of intelligent communication optical cable fault location.
1.Optical fiber fault location principle and GIS system
1.1 Φ-OTDR fault location
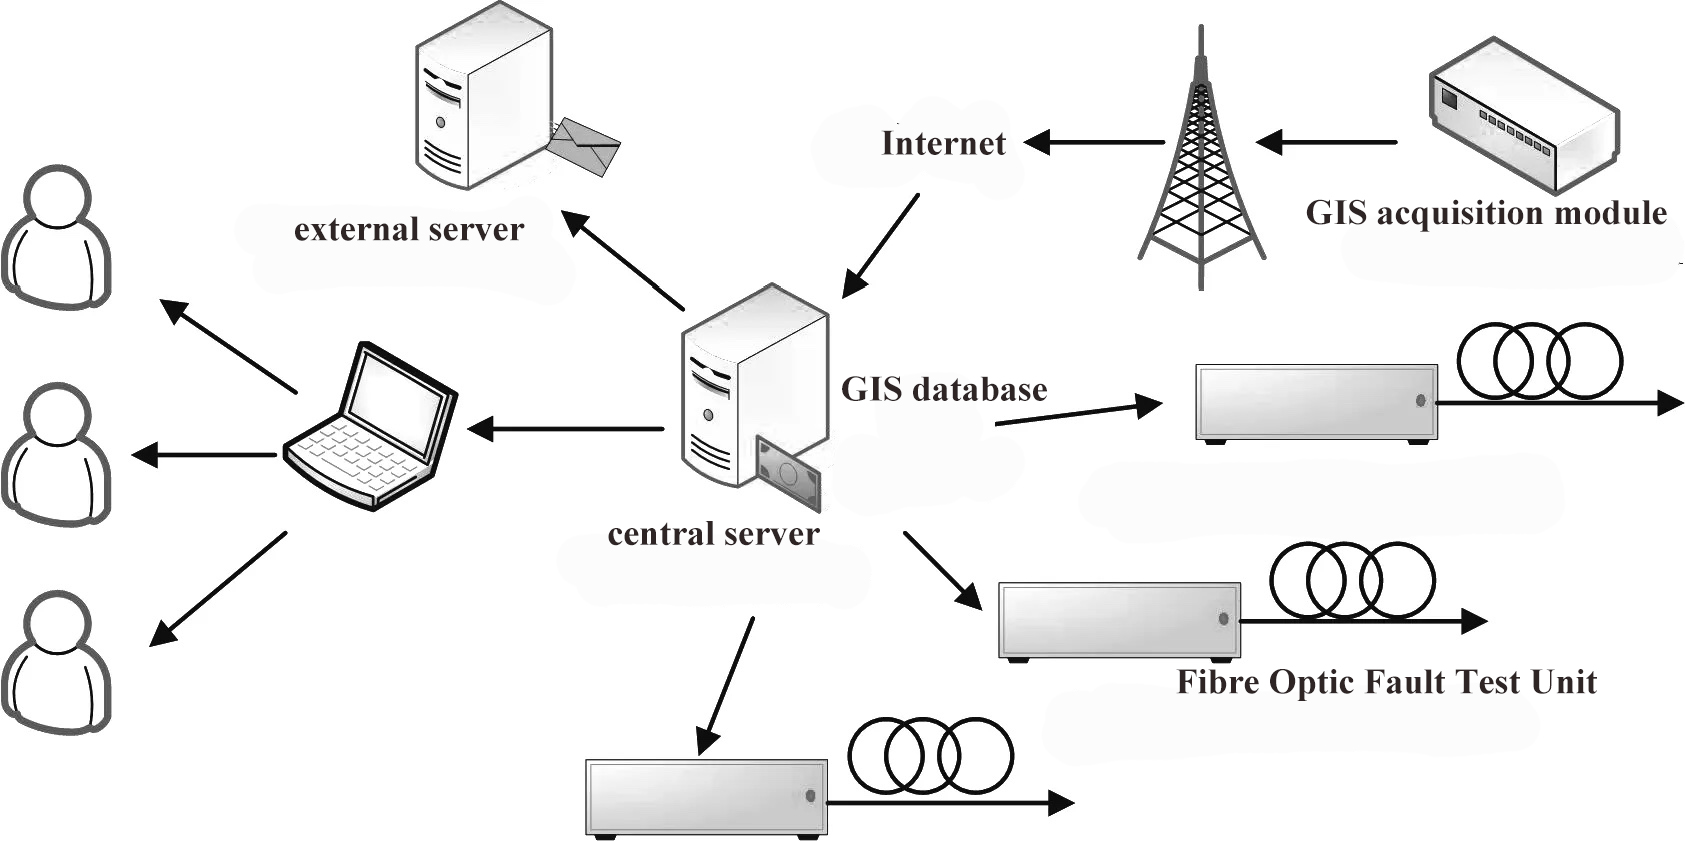
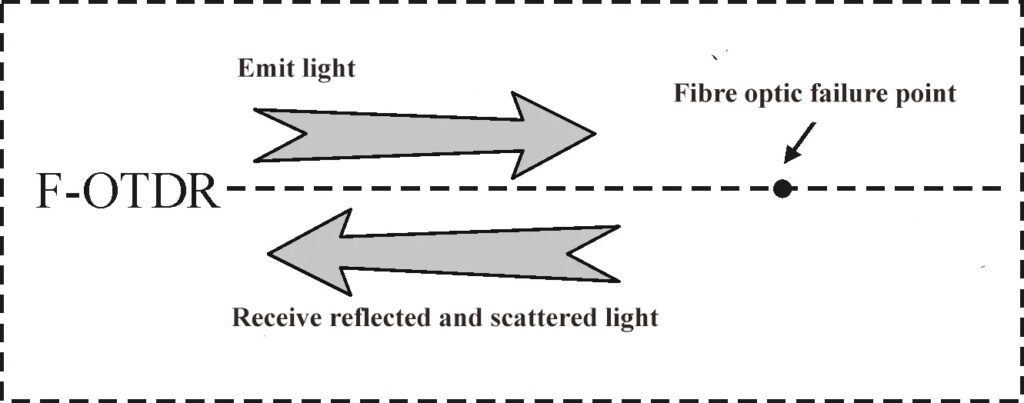
Φ-OTDR technology is developed from the traditional OTDR technology. The difference between the two technologies comes from the improvement of the light source in Φ-OTDR technology, which transforms the characteristic change of light into a signal carrying the vibration state of optical fiber, and then carries out analog-to-digital conversion. Its sensitivity is much higher than that of ordinary OTDR, and It can detect multi-point intrusion events at the same time . In addition, it also has the characteristics of satisfactory execution of high-quality, high-precision and high-in-cohelent lasers under a variety of extreme environmental conditions. The light source is realized by using an electro-opter-modulator as an intensity modulator . Φ-OTDR uses the coherent effect of Rayly scattering to detect vibration; its system is independently designed for high-speed data transmission. The block diagram of the hardware system is shown in Figure 1, and the discrete mirror model is shown in Figure 2.
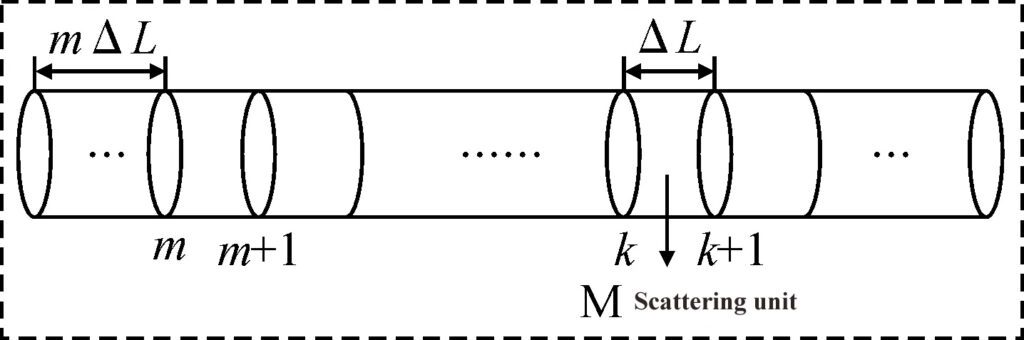
The optical fiber (length L) is divided into N segments equally, and it is composed of M mirrors, and ΔL is the width of the light pulse [13]. The sum of the field vectors in paragraph k is expressed as:
(1)
In the formula: rk is the amplitude of the scatterer on the optical fiber; Φk is the phase sum of the scatterer on the optical fiber; Ωi and ai are the phase value and amplitude of the back-to-back Rayley scatterer in the ΔL range, respectively.
The phase and amplitude probability density function of scattered light is expressed as:
(2)
(3)
In the formula: Φ is a uniform distribution, r is a normal distribution; σ2 is the maximum reflectivity;
1.2 GIS technology
GIS technology provides a method for storing, analyzing, describing and outputting geographic information. It uses geographical models and databases to provide various dynamic and spatial geographic information systems, and displays relevant geographic information in a graphical way. The GIS system is composed of system managers, geospatial data, and computer hardware. and software system composition .
GIS system functions include: data collection, data editing, database management and storage, spatial query, product display, etc. Data collection is to input statistical data, text reports, map data and materialized remote sensing data into the system. Data management and storage can provide the functions of data modification, retrieval, storage and update, and determine the accuracy and efficiency of GIS data analysis. Spatial query includes topology superposition, spatial model and spatial retrieval analysis, which can realize a variety of model analysis such as network and digital terrain, and is the core function of GIS system. Product display is an important function of visual expression of GIS. It outputs a full-element map, and the staff can shrink or enlarge it.
1.3 Optical Fiber Bragg Grating Sensor Theory
The fiber grating has significant advantages such as low insertion loss, high return loss, and simple production. Considering the uniform Bragg grating with an average refractive index fiber, the relationship between each Bragg wavelength (λμ) and the corresponding mode effective index (nμ) is given by the following formula :
λμ=2nμ(λμ)Λ
(4)
In the formula: Λ is the grating period; the subscript μ is the order of the transverse mode.
Due to the periodic change of the refractive index along the optical fiber, the coupling between the two transverse modes is introduced. As a result, the new Bragg wavelength is stimulated. The relationship between the excitation Bragg wavelength and the two corresponding coupling cross-cross modes is given as follows:
λμ,V=[nμ(λμ,V)+nV(λμ,V)]Λ
(5)
In the formula: μ and V are the orders of two different horizontal modes. Since the excited Bragg wavelength λμ, V is located between λμ and λv, the formula (6) can be rewritten as:
λμ,V=(λμ+λV)/2
(6)
Considering the uniform Bragg grating with an average refractive index fiber, the refractive index distribution can be expressed as:
(7)
In the formula: neff is the change of the average refractive index in space during the grating period; v is the edge visibility of the change in refractive index; φ(L) is the grating chir.
The coupling mode equation of the fiber grating is:
(8)
In the formula: K is the coupling coefficient.
2 Optimized design of optical cable fault monitoring system
2.1 Overall design of the system
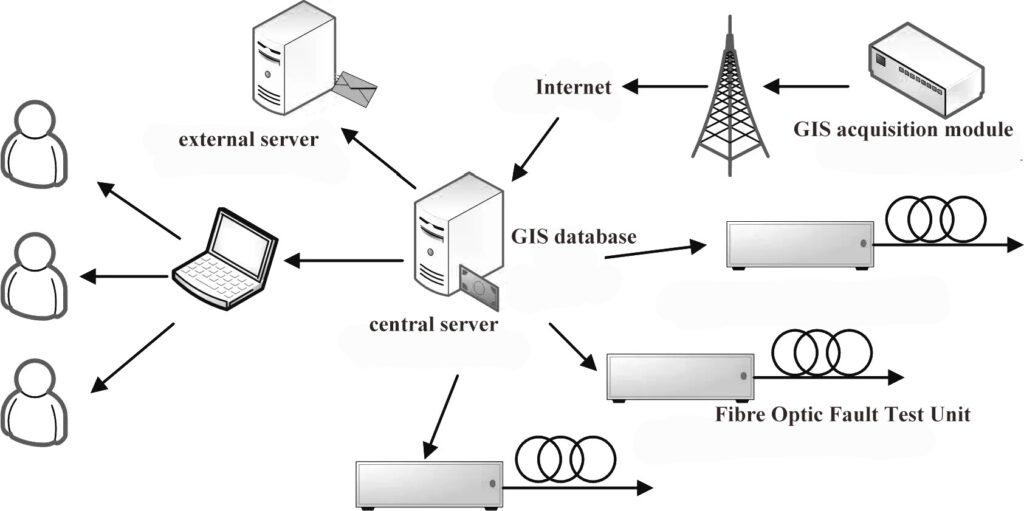
The coupled FBG optical cable monitoring system consists of GIS geographic data acquisition, a subordinate test unit and a central management server. The system framework is shown in Figure 3. Among them, the GIS geographic data acquisition module is used to locate geographical coordinates and transmit geographical data to the central management server through TCP/IP protocol [19]. The central management server is responsible for core functions such as configuration management, fault alarm and data storage. At the same time, the system also includes a client management unit, which can provide data query and maintenance for optical fiber maintenance personnel. It is easy to use and has a simple operation interface.
2.2 Networking method
The network structure is divided into three layers, namely the bottom layer, the middle layer and the top layer. The system network structure is shown in Figure 4.
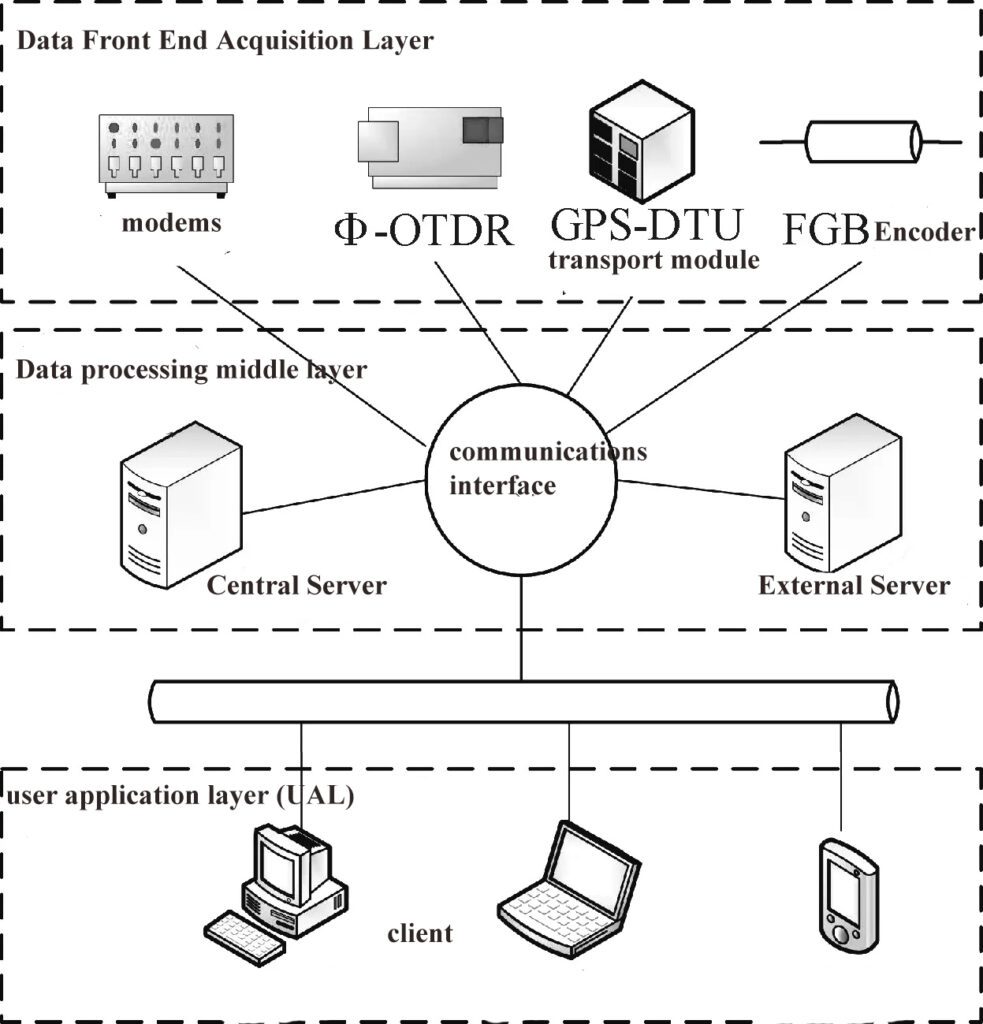
Connect FBG and Φ-OTDR to the 2nd end of the optical fiber, and FBG is used to monitor whether the optical fiber fails. Φ-OTDR can calculate the optical fiber loss distribution characteristic curve, non-destructive detection of the operation status of the optical fiber, and analyze the fault location of the optical fiber. The remote test unit multiplexes Φ-OTDR through wavelength division multiplexers and multiplexes optical switches [20]. The handheld GIS data acquisition module consists of a DTU module and a GPS locator, which converts serial data into IP data and transmits it to the wireless terminal and central manager through the network. The server is the middle layer of the system network structure, including background software, MySQL database, and electronic map. The server is used for Φ-OTDR configuration management, demodulator data analysis, alarm processing, test results and map alarm location functions. Compare the storage length in the system database with the calculation results to determine whether the optical fiber line has failed. If the optical fiber line fails, an optical fiber fault alarm will be issued to the client, the results will be displayed on the electronic map in a visual graphic way, and the optical fiber maintenance staff will be notified. The customer layer is the top layer of the system. Optical fiber maintenance personnel can access the alarm situation on the server, electronic map access and other optical fiber status information through the client browser. The system development mode is BIS mode, which has the advantages of simple operation, strong distribution, easy maintenance and low cost.
2.3 Optical cable network monitoring based on coupled FBG
The optical cable network test module of coupled FBG is shown in Figure 5.
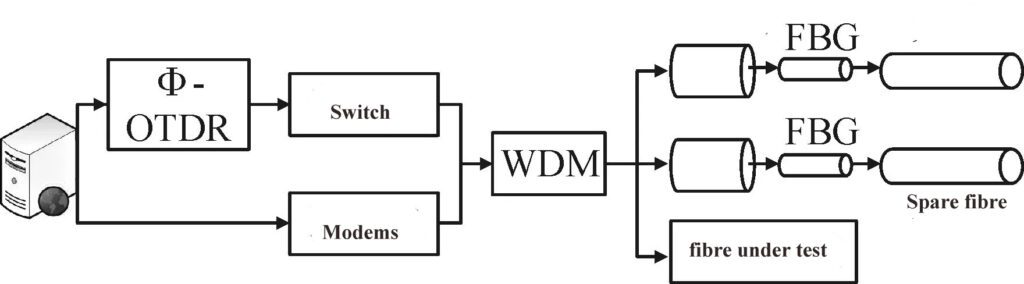
As can be seen from Figure 5, the module adds a fiber grating and demodulator [11] on the basis of the Φ-OTDR interrupt monitoring system. The back-end server connects the demodulator and Φ-OTDR to realize the diagnosis and analysis of data. The coupled FBG reflected light is demodedated by a C-band (1 530 to 1 565 nm) demodulator.
3 Example of fault location
Take the underground communication optical cable from the 6# distribution room of Jianshe East Road to the distribution room of Zhongyuan East Road as an example to verify the effectiveness of intelligent fault monitoring. Measured by Φ-OTDR, the starting point is the 6# distribution room of Jianshe East Road. The Φ-OTDR test data is shown in Figure 6.
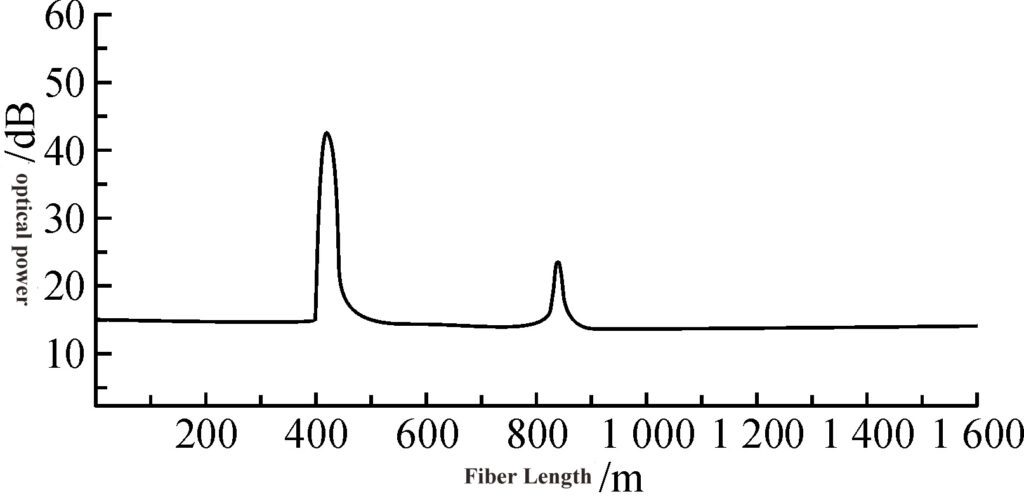
As can be seen from Figure 6, the end of the optical fiber is at 838.3 m, and a reflection event occurs at a distance of 426.6 m from the detection point. Through software inquiry, it was found that the total length of the optical cable was 985 m. By comparing the normal Φ-OTDR test curve of the section in the database, it was determined that there was an active connector from the detection point of 426.6 m. Therefore, it is judged that there is a fracture fault of the optical cable at 838.3 m. No fault point was found by the maintenance personnel at a distance of 838.3 m from the detection point.
The spatial position of the fault point is displayed after the coupled optical fiber and GIS system positioning, as shown in Figure 7. It was found that this section is located in the underground optical cable ditch, and the fault point cannot be found with the naked eye. The distance from the detection location is 635.7 m above the ground, and the direction of the optical cable is complicated. There are many residual cables reserved, which seriously affects the progress of emergency repair through human investigation. The on-site detection found that the linear length of the fault location distance from the detection point is 650.2 m, the absolute error is 0.9 m, and the relative error is 0.13%. The cause of the fault is the fracture of the optical cable. It is further proved that this method can accurately locate the fault location of the communication optical cable.
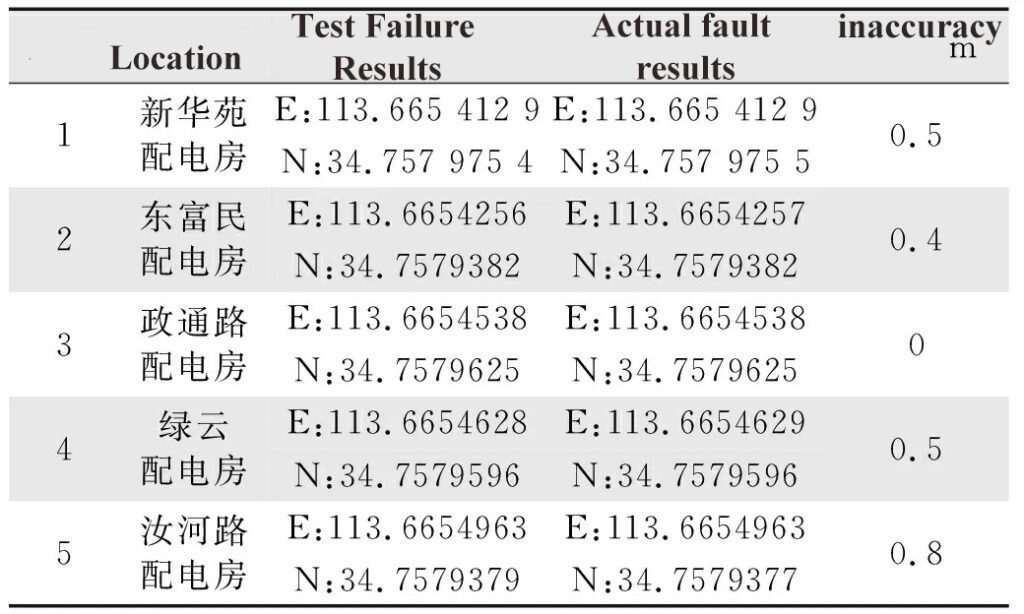
Table 1 Underground communication optical cable fault location results Tab.1 Fault location results of underground communication optical cable
It can be seen from Table 1 that by comparing the fault location of the system with the actual fault location, the system has a high accuracy rate in the actual engineering, which can accurately locate the optical cable fault and effectively ensure the stability of the power system. The traditional fault location method mainly obtains the test curve of the fault location through the Φ-OTDR tester and locates it. It can also be seen from Figure 6 that the end of the optical fiber is 838.3 m away from the test point, and there is a reflection event at 426.6 m. Through the system, the connector is found at 426.6 m, and the total length of the optical cable is 985 m, and then the fault location is determined to be 838.3 m. The maintenance personnel find the fault location along the optical cable according to the linear distance of the analysis data and eliminate it. The maintenance personnel walk at a ground distance, and the failure to accurately locate the fault location seriously delays the maintenance progress.
4 Conclusion
With the continuous expansion of the scale of communication optical cable, its fault frequency is also increasing. Combined with Φ-OTDR technology, optical fiber sensing technology and GIS technology, an intelligent monitoring and information management system for underground communication optical cable based on coupled optical fiber and GIS has been established. The system combines geographical entity objects to calculate the specific fault location, which can send an alarm message to the actual geographical location of the fault communication optical cable and display it to users on the electronic map, achieving a high degree of automation. At the same time, the underground communication optical cable from the 6# distribution room of Jianshe East Road to the distribution room of Zhongyuan East Road as an example has been verified. The system has a high accuracy rate and can accurately locate the optical cable fault, with an absolute error of 0.9 m and a relative error of 0.13%.